5 Ways Data Analytics Can Help Drive Sales For Your Business

5 Ways Data Analytics Can Help Drive Sales For Your Business

Companies that concentrate on their customers can attain incredible sales figures for several reasons. The current generation of consumers is not impressed with traditional advertising strategies. Instead, they want to feel valued as an individual, meaning they want the company to anticipate the customers’ needs in a personalized an accurate manner. And this level of personalization is something that data analytics can help a company achieve.

As customers’ demands grow, so should your product line. By predicting your customers’ needs, you can get ahead of the game, ensuring that your customer conversion and retention rates remain high. Having said this, it’s necessary to study your competition and how other players in your industry are using customer data to their advantage. If data is not used in a targeted and actionable manner, there’s a good chance your brand will lose traction in your space, paving the way for the competition to increase their share of the market at the expense of yours.

How can data analytics drive sales for your company?

1) Enabling segmentation: Segmentation is the key to building a well-catered product line. One size does not fit all in business these days; if you are trying to sell your products to every population segment, your marketing strategy will likely fail to hit the mark with some customers. A product’s popularity varies based on multiple factors, including buying habits, age, sex, product usage, etc. Through effective segmentation, you can personalize your marketing strategy according to the needs of a specific customer segment. This technique can help you go a long way in deciding what product is best-suited for which customer group, expanding your customer base and increasing your company’s sales figures.

2) Product development: Customization is the key to a good sales strategy. In order to stay ahead of the competition, companies need to compile and analyze data about their customers. Examining customer feedback is an effective way to determine how to sell your product as you can use this information to inform your marketing strategy. Using this information allows companies to work out any inefficiencies in their sales strategies, ensuring they emerge victorious in the competition. For example, companies such as Netflix and Amazon look at the viewer response rate for their shows and use this data to decide which shows to highlight on the homepages of their streaming services.

3) Help customers decide what they want: The best thing about data analytics is its power to make accurate predictions. By using strong predictive algorithms, companies can forecast what customers might want in the future. Not only is this an integral part of the sales prediction model, but it can also go a long way in helping retain the right customers. Customers might want to order the products being showcased and continue doing business with a company if the products they suggested appeal to them, which ultimately bolsters a company’s revenue and profitability. This approach helps companies retain customers as they are constantly reminded of products they may find appealing.

4) Pricing the products right: Pricing plays an integral role in helping companies put their products forward to the customers. Some industries can be extremely competitive, which means that a company can fail if it does not have the right data to inform them what the right prices are for each product. Through the use of data-driven pricing strategies, the right price can be easily unearthed by analyzing the competition, making it possible for companies to set the right prices on the right products. Pricing decisions can also be influenced based on customer spending patterns, allowing the company’s sales teams to ensure a price that is both profitable and affordable is set to a product.

5) Email campaigns: There is no denying that emails are one of the best ways to reach your customers. Having said this, one could also say that analytics can be used to capture which email subject phrases and words are most likely to capture the interest of the customers. This can only be achieved through the use of analytics. Understanding response rates, as well as the best days and times to send emails are useful ways to determine how to advertise products or services to customers via email campaigns.

Analytics can help businesses understand their data, while also helping them conduct a deeper dive into the ways and means in which this data can be used to enhance business operations. The more a company understand the data, the more effectively it can be used. Due to this very reason, it is important for businesses to use the right tools and unearth the right insights in order to inform their decision-making. When done right, this leads to higher customer retention rates and a higher profit margin.

Also Read

Thinking about DevOps culture? Inculcate these 5 must haves to make the most of it
How Cloud Computing is changing the Business World
Best Practices for Ensuring DevOps Security

Advantages of Cloud Analytics over On-Premise Analytics

Advantages of Cloud Analytics over On-Premise Analytics
Majority of the organizations now agree that data science is a great tool to scale-up, build and streamline their businesses. But, with this huge amount of data they are collecting, are the organizations really coping up to analyze and implement the decisions in time? Most of them, in-spite of having on-premise analytics teams are in disconnection with their operations part.

Having the in-house analytics teams linked to your Enterprise Resource Planning(ERP) systems can be sometimes be irresponsive due to data loads, might cause your sales teams to lose the real-time data, also can cause delay in response to the queries. Collection of data from various internal applications, devices, online media networks, consumer data and converting them into actionable insights can be a cost consuming (both time and capital costs) process for the organizations.

Is there any better way of utilizing your Company’s data towards reaping benefits?
Yes, most of your valuable data from modes of communication to collecting track-able data of consumer behavior lies in the cloud. Cloud computing allows you to easily consolidate information from all your communication channels and resources, and helps you to do it in a wider scale.

Cloud, basically helps the business’ data teams to re-establish the connection with their operations. And hence the business will be able to minimize the time and capital costs incurred, from the research and development of the product, marketing and sales to increasing the efficiency of your consumer support teams.

How does Cloud Analytics serve as a better and real-time mode of efficient data management?

Agile Computing Resources
Instead of handling speed and delivery time related hassles from your on-premise servers, cloud computing resources are high-powered and can deliver your queries and reports in no-time.

Ad hoc Deployment of Resources for Better Performance
If you are having an in-house analytics team, you should be concerned about an efficient warehouse, latency of your data over poor public internet, being up-to date with advanced tools and experience in handling the high demands for real-time BI or emergency queries. Employing Cloud services in data science and analytics can help your business scale-up by establishing a direct connection between them, reducing the latency and response issues to less than a millisecond.

Match, Consolidate and Clean Data Effortlessly
Real time Cloud analytics with real-time access to your online data keeps your data up-to date and organized, helping your Operations and Analytics teams function under the same roof. This makes sure of no mismatches and delays, helping you to also predict and implement finer decisions.

Accessibility
Cloud services are capable in sharing data and visualization and performing cross-organizational analysis, making the raw data more accessible and perceivable by a broader user base.

High Returns on Time Investments
Cloud services provide readily-available data models, uploads, application servers, advanced tools and analytics. You need not spend any time in building up a separate infrastructure, unlike employing on-premise analytics teams.

Your marketing teams can forecast and segment your campaign plans, the campaign reports and leads generated are readily available to your sales teams to follow-up, insights from sales and marketing and more real time consumer data can help your strategy teams in predicting crucial decisions or your support teams being immediately notified with consumer queries. Better the collaboration, higher are your returns, and an ideal cloud service can make this possible.

Flexible and Faster Adoption
Cloud-based applications are built with self-learning models and have a consumer friendly user experience unlike the on-premise applications. Cloud technologies learn to adopt as your business grows and can expand or adjust as your data storage and applications needs increase or decrease.

Affordability
There are no upgrade costs or issues, and enabling new tools or applications require minimal IT maintenance. This keeps the business in a continuous flow without any interventions like the need for upgrading the on-premise infrastructure, and having to redo your integrations and other time consuming efforts.

Security
Robustly built, Cloud analytics are reportedly more reliable than on-premise systems in times of a data breach. Detecting a breach or a security issue can be within hours or minutes with Cloud security whereas with an in-house team, it takes weeks or even months in detecting a breach. Your data is more trusted and secure with cloud computing.

Implementing cloud services in data science can be the best and most-effective infrastructure you can give to your business. They are agile, secure and flexible and help you to streamline each of your business process as Cloud services enable all your teams function under the same data foundation.

Related Stories

5 Exciting New Database Services from AWS re:Invent 2017
Infographic: Cloud Computing Market Overview 2017
Top Roles of Cloud Computing in IoT
Future of AWS Cloud Computing
Overcoming Cloud Security Threats with AI and Machine Learning

Why is Big Data Analytics Technology so Important

Big Data Analytics Technology

Yes! Big Data Analytics, as well as Artificial Intelligence, has truly shown its importance in today’s business activities. Corporations & Business sectors are coming up with their procedures to data analytics as the aggressive landscape modifications. Records analytics is slowly becoming entrenched in the enterprise. Today, it’s a well-known behavior and desired practice for companies to apply analytics to optimize something, whether or not it’s operational performance, false detection or purchaser reaction time.

To this point, usage has been pretty easy. Maximum agencies are still doing descriptive analytics (historic reporting) and their use of analytics is characteristic-unique. But in upcoming years more business areas will follow the leaders and boom their levels of class, the use of predictive and prescriptive analytics to optimize their operations. Moreover, extra groups will begin coupling feature-specific analytics to get new intuition & observation into client journeys, risk profiles, and marketplace opportunities.

The “leading” companies were also much more likely to have some sort of cross-purposeful analytics in vicinity enabled via a common framework that enables collaboration and statistics sharing. These pass-practical views allow agencies to recognize the effect of cross-useful dynamics consisting of supply chain effects.

Predictive and Prescriptive Analytics

Whilst descriptive analytics continues to be the maximum popular shape of analytics today, it is no longer the satisfactory manner to advantage a competitive side. Businesses that want to move beyond “doing business through the rear-view mirror” are the use of predictive and prescriptive analytics to decide what is going to possibly arise. Prescriptive analytics has the delivered advantage of recommending movement, which has been the number one gripe approximately descriptive and predictive analytics. The forward-searching abilities enabled through predictive and prescriptive analytics allow groups to plan for possible outcomes, excellent and bad.

Armed with the in all likelihood styles predictive and prescriptive analytics screen; agencies can identify fraud faster or intrude sooner when it seems that a consumer is set to churn. The mixed foresight and timelier action help corporations force extra sales, reduce risks, and improve consumer delight.

Artificial Intelligence (AI)

Artificial intelligence (AI) and gadget learning culture take analytics to new ranges, figuring out previously undiscovered patterns which can have profound outcomes on a commercial enterprise, consisting of identifying new product opportunities or hidden dangers.

Machine intelligence is already constructed into predictive and prescriptive analytics equipment, dashing insights and enabling the analysis of well-sized probabilities to determine the greatest route of movement or the first-rate set of alternatives. Over the years, extra state-of-the-art forms of AI will find their way into analytics systems, similarly enhancing the rate and accuracy of selection-making.

Governance and Security

Groups are supplementing their information with third-celebration records to optimize their operations, comprehensive of adapting useful resource degrees primarily based at the expected level of consumption. They are also sharing statistics with users and companions who necessitate robust governance and a focal point of safety to reduce information misuse and abuse. However, protection is turning into an increasing number of the complex as more ecosystems of records, analytics, and algorithms interact with every other.

Given latest excessive-profile breach instances, it has emerged as clean that governance and safety have to be applied to information at some point in its lifecycle to reduce facts-associated risks.

Developing Statistics

Facts volumes are developing exponentially as agencies connect to statistics outside their internal structures and weave IoT devices into their product lines and operations. Because the records volumes continue to grow, many groups are adopting a hybrid records warehouse/cloud strategy out of necessity. The businesses maximum in all likelihood to have all their records on-premises keep it there due to the fact they’re involved in security.

Groups incorporating not gadgets into their enterprise strategies are both adding an informational element to the bodily products they produce or including sensor-based total information to their existing corpus of statistics. Depending on what is being monitored and the use case, it could be that every piece of information does no longer have value and no longer each issue calls for human intervention. While one or each of those things are authentic, aspect analytics can help identify and remedy as a minimum some common issues routinely, routing the exceptions to human decision-makers.

10 Hot Data Analytics Trends — and 5 Going Cold

Big data, machine learning, data science — the data analytics revolution is evolving rapidly. Keep your BA/BI pros and data scientists ahead of the curve with the latest technologies and strategies for data analysis.

Data analytics are fast becoming the lifeblood of IT. Big data, machine learning, deep learning, data science — the range of technologies and techniques for analyzing vast volumes of data is expanding at a rapid pace. To gain deep insights into customer behavior, systems performance, and new revenue opportunities, your data analytics strategy will benefit greatly from being on top of the latest data analytics trends.

Here is a look at the data analytics technologies, techniques and strategies that are heating up and the once-hot data analytics trends that are beginning to cool. From business analysts to data scientists, everyone who works with data is being impacted by the data analytics revolution. If your organization is looking to leverage data analytics for actionable intelligence, the following heat index of data analytics trends should be your guide.
Read more..

Big Data and Data Visualization

In recent years, there has been a dramatic rise of unstructured data from different sources such as social media, videos and photos, and businesses are looking for relationships between data which can be viewed from multiple perspectives. This evolution of the way the data is being produced, processed and analysed is bringing drastic changes to the world around us.

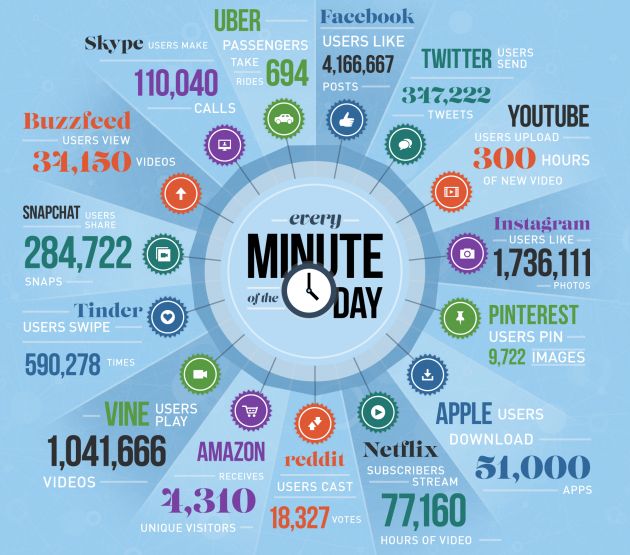
Big data is a term describing large volumes of structured and unstructured data that can be analysed to gain business insights. According to Gartner, big data is a high-volume, high-velocity and high-variety information asset that demands cost-effective innovative forms of information processing for enhanced insight and decision making. In simpler terms, big data is lots of data produced rapidly in many different forms. This rapidly growing data could be related to online videos, customer transactional histories, social media interactions, traffic logs, cell phones, flip computers, tablets, cloud computing, Internet of Things, sensors etc., and global traffic is expected to reach more than 100 trillion gigabytes by 2025. Here is a hint what happens approximately in a minute on the internet, and the generated data continues to grow exponentially:
internet-one-minute-infographic

This huge volume of data needs to be parsed to discover useful threads that can uncover endless opportunities, and can be teamed with innovative ideas to decrease costs, improve overall customer satisfaction, increase revenue, and provide customer tailored offerings. The data requires quick analysis and information must be displayed in a meaningful way. It can be analysed for time reductions, cost reductions, smart decision making, optimizing offerings or new product development.

Big Data focuses on finding hidden trends, threads or patterns that might not be immediately or easily visible. The interpretations bring out insights that would otherwise be impossible to observe using traditional methods. This requires latest technologies and skill set to analyse the flow of information and draw results and conclusions. High powered analytics enable businesses to determine root causes of issues, defects and failures in real time, recalculate complete risk portfolios in just minutes, detect fraud, and so on. NASA, U.S.Government, and organisations like Wal-Mart and Amazon are using Big Data to recognize the possibilities that can help them capitalize the gains.

However, this huge volume of rapidly generating big data cannot be handled using traditional reporting process. To reap maximum benefits, data analytics needs to be done in real time instead of batch processing which fails to capture big data’s immediacy. Another challenge in handling big data is the increased availability of mobile devices. This requires decentralization of reports and adoption of cost-effective, faster and more democratized business intelligence model to improve collaboration and speed insights.

Data Visualization Tools

To make sense of the boring raw data and observe interesting patterns, organisations use visualization tools that help them visualize all their data in minutes. Data Visualization places data in the visual context such as trends, patterns and correlations, which helps organisations understand the significance of the data which may go undetected if this data was just text-based. This beneficial visual matter can help companies eliminate loss making products and increase revenue by minimizing waste. Data visualization can help identify areas that require attention or improvement, help understand product placement, clarify factors influencing customer behaviour and can predict sales volume.

Some of these tools are for developers and require coding, while others contain data visualization software products that do not require coding. Here are some of the commonly used data visualization tools:

1. D3.js (Data Driven Documents) uses CSS, HTML and SVG to render diagrams and charts. The tool is open-source, looks good, is packed with helpful features and is interactivity rich.
2. FusionCharts has an exhaustive collection of maps (965) and charts (90) that work across all platforms and devices, and supports browsers starting from IE6. It supports XML and JSON data formats, and can export charts in JPEG, PNG and PDF. For inspiration, there is a good collection of live demos and business dashboards. Although, the tool is slightly highly priced, it has beautiful interactions and is highly customizable.
3. Chart.js is an open source library that supports bar, line, polar, pie, radar and doughnut chart types. The tool is good for smaller hobby projects.
4. Highcharts offers good range of maps and charts right out of the box. It also offers a different feature rich package called Highstock for stock charts. The tool is free for personal and non-commercial use, and users can export charts in JPG, PNG, PDF and SVG formats.
5. Google Charts can render charts in SVG/HTML5 . It offers cross-browser compatibility and cross-platform portability to Android and iPhones.
6. Datawrapper is commonly used by the non-developers to make interactive charts. The tool is easy to use and can generate effective graphics.
7. Tableau Public is one of the most commonly used visualization tool as it supports variety of maps, graphs, charts and other graphics. The tool is free and can be easily embedded in any webpage.

Raw, Timeline JS, Infogram, plotly, and ChartBlocks are some of the additional data visualization tools. Excel, CVS/JSON, GooGle Chart API, Flot, Raphael, and D3 are some of the entry level tools which are good to quickly explore data or create visualization for internal use.

On the other end of spectrum, there are professional data visualization Pro tools that have expensive subscriptions. There are few free alternatives as well with strong communities and support. Some of these tools include R, Weka, and Gephi.

These data based visualization tools are focussed on the front end of the big data that enable businesses to explore the information and gain deeper understanding by interacting directly with the data. On the other hand, Apache Hadoop is an open source software associated with Big Data to support the back-end concerns such as processing and storage. There are several variants of Hadoop such as MapR, Hortonworks, Cloudera and Amazon. Google BigQuery is a cloud-based service.

Businesses seek most cost-effective ways to increase profitability by managing volume, velocity and variety of the data and turning that data into valuable information to better understand business, customers and marketplace. However, volume, velocity and variety are no longer sufficient to describe the challenges of big data, hence more terms such as variability, veracity, value and visualization have been added that broaden the realm of the big data scope. Big Data is exploding with innovative approach and forward thinking, and organisations can exploit this opportunity to gain market advantage and increase profitability.

Data analytics isn’t about Insights. Idexcel Big Data Roundup

1. How To Use Data To Outsmart Your Competitors

The pressure’s on to use data to outsmart your competitors. Here are six ways companies can use data to imagine and even re-imagine what’s possible.

“Business as usual” can be a risky business practice, especially when there’s cultural resistance to change. While some companies are embracing agile practices, there are a number of data-related barriers that keep companies from reaching their potential, most of which have to do with people, processes, and technology. Read more…

2. Ten Ways Big Data Is Revolutionizing Supply Chain Management

Bottom line: Big data is providing supplier networks with greater data accuracy, clarity, and insights, leading to more contextual intelligence shared across supply chains.

Forward-thinking manufacturers are orchestrating 80% or more of their supplier network activity outside their four walls, using big data and cloud-based technologies to get beyond the constraints of legacy Enterprise Resource Planning (ERP) and Supply Chain Management (SCM) systems. For manufacturers whose business models are based on rapid product lifecycles and speed, legacy ERP systems are a bottleneck. Designed for delivering order, shipment and transactional data, these systems aren’t capable of scaling to meet the challenges supply chains face today. Read more…

3. How Data Projects Drive Revenue Goals

The vast majority of organizations have either already implemented a big data project or plan to do so, according to a recent survey from CA Technologies. The report, titled “The State of Big Data Infrastructure: Benchmarking Global Big Data Users to Drive Future Performance,” indicates that a great deal of these projects are integrated throughout the entire organization. Companies are pursuing big data and analytics primarily to improve the consumer experience while adding to their customer base. However, there are formidable challenges, including a lack of trained staffing to make data projects succeed, as well as the inherent complications of such implementations. Read more…

4. Importance of Big Data Analytics for Business Growth

Until recent years companies have always evaded the question of using data analytics for business execution, leave alone big data. Most of the time it was due to cost of analysis that the organisations kept in mind while keeping away from data analytics. With everything going digital, data is pouring in from all kinds of sources imaginable. Organisations are getting inundated with terabytes and petabytes of data in different formats from sources like operational and transactional systems, customer service points, and mobile and web media. The problem of such huge data is storage and with no proper utilisation of the data, collecting and storing is a waste of resource. Earlier it had been difficult to process such data without relevant technology. Read more…